


 Feed
Feed Scan with QR Code Reader
 mobi
mobi- Advertise / Donate
Welcome !
Newquay weather receives over 1000 vistors per day winter time, rising to over 3000 to 4000 or more in the summer, including visitors from all over the world.
Please help support this site

Your business

Via Paypal
- Accommodation
Hotels, B&B's and Caravan and Camping Sites

Porth Sands - Luxury beach accommodation wth beach facing balconies, a golden sandy beach making it the perfect place to idle away the hours- swimming, body boarding, sunbathing and paddling.
- Food
Restaurants, Cafe's, Takeaways

Pachanga - Pachanga Authentic Mexican Since 2016 we've been re-creating dishes that are part of our cultural heritage using techniques that are unique to Mexico. We use mostly Mexican, local & organic produce in our dishes & drinks
- Charity Events
Charity Events - Max 3 free ads
For a Free Charity Ad Here, please contact me- - Houses for Sale
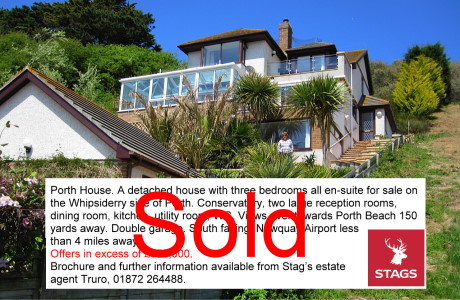
Houses for Sale
Advertise your house for sale here and help support this site.
Small photo, text + link to agents for a One off ₤25. Please contact me.Advertise your house for sale here

- Local Services
Shops, Services etc

Towan Insurance BrokersCornwall's local commercial insurance specialist. We help Cornish businesses find the right cover, from tradespeople and property owners to specialist contractors. Based in Cornwall, independent, and genuinely invested in the businesses we work with. Visit us at Towan Insurance Brokers
Newquay Tides
BST starts Sunday 29th March 2026GMT from Sunday 25th October 2026
Months Tide Table
Here for other Cornish locations
Environment Agency - Newquay Bathing Water Quality
South West Water Beach Live
Height in metres, time adjusted to GMT/BST.
Daily Graph
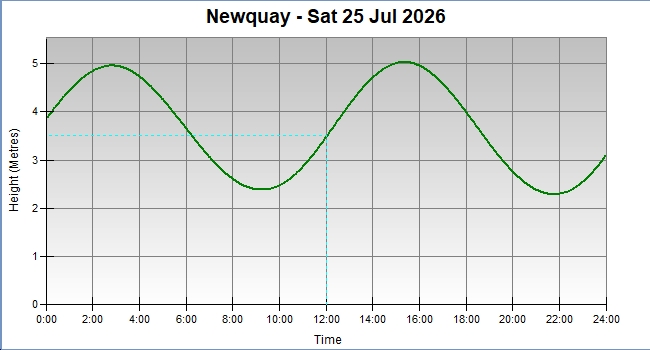
Daily high/low tides for seven days
Listen to todays tides, click the speaker icon top left
| Date | Time | Height |
|---|---|---|
| 25 July 2026 | 02:46 | 4.95 |
| 25 July 2026 | 09:12 | 2.38 |
| 25 July 2026 | 15:20 | 5.03 |
| 25 July 2026 | 21:45 | 2.29 |
| 26 July 2026 | 03:49 | 5.12 |
| 26 July 2026 | 10:11 | 2.19 |
| 26 July 2026 | 16:14 | 5.29 |
| 26 July 2026 | 22:38 | 2.03 |
| 27 July 2026 | 04:38 | 5.37 |
| 27 July 2026 | 10:59 | 1.92 |
| 27 July 2026 | 16:59 | 5.61 |
| 27 July 2026 | 23:24 | 1.72 |
| 28 July 2026 | 05:20 | 5.67 |
| 28 July 2026 | 11:41 | 1.64 |
| 28 July 2026 | 17:37 | 5.94 |
| 29 July 2026 | 00:04 | 1.42 |
| 29 July 2026 | 05:56 | 5.95 |
| 29 July 2026 | 12:18 | 1.38 |
| 29 July 2026 | 18:12 | 6.23 |
| 30 July 2026 | 00:40 | 1.18 |
| 30 July 2026 | 06:31 | 6.17 |
| 30 July 2026 | 12:53 | 1.17 |
| 30 July 2026 | 18:46 | 6.46 |
| 31 July 2026 | 01:15 | 1.00 |
| 31 July 2026 | 07:04 | 6.33 |
| 31 July 2026 | 13:27 | 1.03 |
| 31 July 2026 | 19:20 | 6.61 |
Red denotes hightides
Graph and data produced by Belfield Tide Plotter http://www.belfieldsoftware.co.uk
using Seven Day Tides script V1.20 - 11-Oct-2009
These tide predictions are provided WITHOUT ANY WARRANTY.
Remember that weather conditions affect tidal ranges and ocean currents.
Please consult Admiralty EasyTide for accurate tidal information.
© Crown Copyright and/or database rights. Reproduced by permission of the Controller
of Her Majesty's Stationery Office and the UK Hydrographic Office.
