


 Feed
Feed Scan with QR Code Reader
 mobi
mobi- Advertise / Donate
Welcome !
Newquay weather receives over 1000 vistors per day winter time, rising to over 3000 to 4000 or more in the summer, including visitors from all over the world.
Please help support this site

Your business

Via Paypal
- Accommodation
Hotels, B&B's and Caravan and Camping Sites

Porth Sands - Luxury beach accommodation wth beach facing balconies, a golden sandy beach making it the perfect place to idle away the hours- swimming, body boarding, sunbathing and paddling.
- Food
Restaurants, Cafe's, Takeaways

Pachanga - Pachanga Authentic Mexican Since 2016 we've been re-creating dishes that are part of our cultural heritage using techniques that are unique to Mexico. We use mostly Mexican, local & organic produce in our dishes & drinks
- Charity Events
Charity Events - Max 3 free ads
For a Free Charity Ad Here, please contact me- - Houses for Sale
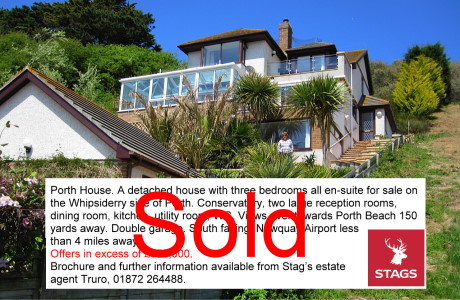
Houses for Sale
Advertise your house for sale here and help support this site.
Small photo, text + link to agents for a One off ₤25. Please contact me.Advertise your house for sale here

- Local Services
Shops, Services etc

Towan Insurance BrokersCornwall's local commercial insurance specialist. We help Cornish businesses find the right cover, from tradespeople and property owners to specialist contractors. Based in Cornwall, independent, and genuinely invested in the businesses we work with. Visit us at Towan Insurance Brokers
Space Weather Observations, Alerts, and Forecast
Current Space Weather Overview

|
Tweets by _SpaceWeather_ |
3-day Solar-Geophysical Forecast
Product: 3-Day Forecast
- Issued: 2026 Jun 19 1230 UTC
Prepared by the U.S. Dept. of Commerce, NOAA, Space Weather Prediction Center.
Geomagnetic Activity Observation and Forecast
The greatest observed 3 hr Kp over the past 24 hours was 3 (below NOAA Scale levels). The greatest expected 3 hr Kp for Jun 19-Jun 21 2026 is 3.67 (below NOAA Scale levels).
| Jun 19 | Jun 20 | Jun 21 | |
|---|---|---|---|
| 00-03UT | 3.00 | 2.67 | 2.67 |
| 03-06UT | 2.33 | 3.67 | 3.00 |
| 06-09UT | 0.67 | 2.67 | 3.00 |
| 09-12UT | 2.33 | 2.67 | 2.67 |
| 12-15UT | 3.67 | 1.67 | 1.67 |
| 15-18UT | 3.67 | 1.67 | 1.67 |
| 18-21UT | 2.67 | 2.67 | 1.67 |
| 21-00UT | 2.67 | 3.00 | 2.00 |
Rationale: No G1 (Minor) or greater geomagnetic storms are expected. No significant transient or recurrent solar wind features are forecast.
Solar Radiation Activity Observation and Forecast
Solar radiation, as observed by NOAA GOES-18 over the past 24 hours, was below S-scale storm level thresholds.
| Jun 19 | Jun 20 | Jun 21 | |
|---|---|---|---|
| S1 or greater | 1% | 1% | 1% |
Rationale: No S1 (Minor) or greater solar radiation storms are expected. No significant active region activity favorable for radiation storm production is forecast.
Radio Blackout Activity and Forecast
No radio blackouts were observed over the past 24 hours.
| Jun 19 | Jun 20 | Jun 21 | |
|---|---|---|---|
| R1-R2 | 15% | 15% | 15% |
| R3 or greater | 1% | 1% | 1% |
Rationale: There is a slight chance for R1 (Minor) radio blackouts over 19-21 Jun.
Real Time Images of the Sun
SOHO EIT 171
|
SOHO EIT 195
|
SOHO EIT 284
|
SOHO EIT 304
|
SDO/HMI Continuum
|
SDO/HMI Magnetogram
|
LASCO C2
|
LASCO C3
|
Solar Wind
Real-Time Solar Wind
Real-Time Solar Wind data broadcast from NASA's ACE satellite. |
|
WSA-Enlil Solar Wind Prediction |
| Move your cursor over the timeline to 'scrub' through the forecast. |
Solar Cycle
The Solar Cycle is observed by counting the frequency and placement of sunspots visible on the Sun. The forecast comes from the Solar Cycle Prediction Panel representing NOAA, NASA and the International Space Environmental Services (ISES). The Prediction Panel has predicted Cycle 25 to reach a maximum of 115 occurring in July, 2025. The solar radio flux at 10.7 cm (2800 MHz) is an excellent indicator of solar activity. Often called the F10.7 index, it is one of the longest running records of solar activity. The F10.7 radio emissions originates high in the chromosphere and low in the corona of the solar atmosphere. The F10.7 correlates well with the sunspot number as well as a number of UltraViolet (UV) and visible solar irradiance records.
Auroral Activity Forecast
Northern Hemi Auroral Map
|
Southern Hemi Auroral Map
|
Radio Communications Impact
D-Region Absorption
D-Region Absorption Prediction
|
VHF and HF Band Conditions
|
|
|
Credits:
Space Weather Images and Information (excluded from copyright) courtesy of:NOAA / NWS Space Weather Prediction Center
Mauna Loa Solar Observatory (HAO/NCAR)
SOHO (ESA & NASA).
Space Weather links:
3-Day Forecast of Solar and Geophysical Activity
Space Weather Overview
LASCO Coronagraph
Real-Time Solar Wind
Space Weather Advisory Outlooks
Space Weather Forecast Disussions
Space Weather Alerts, Watches and Warnings
Solar and Heliospheric Observatory (SOHO)
The Very Latest SOHO Images
Powered by Space Weather PHP script by Mike Challis
additions by Martin of Hebrides Weather and Ken True of Saratoga Weather
with 3-day Solar-Geophysical Forecast text formatting by Jeremy Dyde of Jerbils Weather
