


 Feed
Feed Scan with QR Code Reader
 mobi
mobi- Advertise / Donate
Welcome !
Newquay weather receives over 1000 vistors per day winter time, rising to over 3000 to 4000 or more in the summer, including visitors from all over the world.
Please help support this site

Your business

Via Paypal
- Accommodation
Hotels, B&B's and Caravan and Camping Sites

Porth Sands - Luxury beach accommodation wth beach facing balconies, a golden sandy beach making it the perfect place to idle away the hours- swimming, body boarding, sunbathing and paddling.
- Food
Restaurants, Cafe's, Takeaways

Pachanga - Pachanga Authentic Mexican Since 2016 we've been re-creating dishes that are part of our cultural heritage using techniques that are unique to Mexico. We use mostly Mexican, local & organic produce in our dishes & drinks
- Charity Events
Charity Events - Max 3 free ads
For a Free Charity Ad Here, please contact me- - Houses for Sale
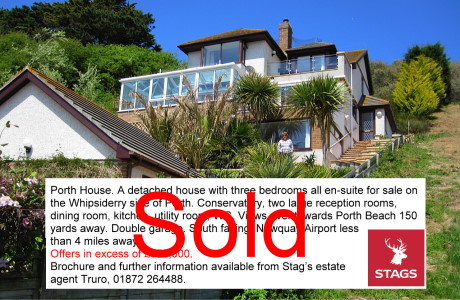
Houses for Sale
Advertise your house for sale here and help support this site.
Small photo, text + link to agents for a One off ₤25. Please contact me.Advertise your house for sale here

- Local Services
Shops, Services etc

Towan Insurance BrokersCornwall's local commercial insurance specialist. We help Cornish businesses find the right cover, from tradespeople and property owners to specialist contractors. Based in Cornwall, independent, and genuinely invested in the businesses we work with. Visit us at Towan Insurance Brokers
Sun Spots
- Sunspots are solar magnetic storms. The spots appear darker because the temperature of the spots are lower than the surrounding photosphere.
- They serve as a reservoir for solar flares and coronal mass ejections, which cause Aurorae, power/communication outages, and satellite anomalies.
- The Sun-s activity waxes and wanes in an 11-year sunspot cycle; Solar Minimum is when the number of sunspots are lowest.
- There seems to be a correlation between Solar Min/Maximum and Earth-s weather. The extent to which Ozone,
stratospheric winds,
global circulation patterns, and cloud seeding are all affected are still being studied. - Serious eye damage can result from viewing the Sun directly with the naked eye or with any
unfiltered optical
device, such as binoculars or a telescope. ** Please be careful out there. **
| Sunspots - Each graph has the latest image as a background | ||||||||||||||||||||||||||||||||
| Sunspots - last 30 days - latest HMI Continuum image | Sunspots - last 30 days | |||||||||||||||||||||||||||||||
|
|
| |||||||||||||||||||||||||||||||
| Current quarter - latest EIT image
[ 2026 data table in a popup ] 2021 to Yesterday - latest MDI image [ 2026 data table in a popup ] Sunspots 1700 to 2025 - latest HMI Magnetogram Image Data Source: WDC-SILSO, Royal Observatory of Belgium, Brussels Yearly mean total sunspot number from 1700 Yearly mean total sunspot number obtained by taking a simple arithmetic mean of the daily total sunspot number over all days of each year. (NB: in early years in particular before 1749, the means are computed on only a fraction of the days in each year because on many days, no observation is available). Catania Sunspot Groups 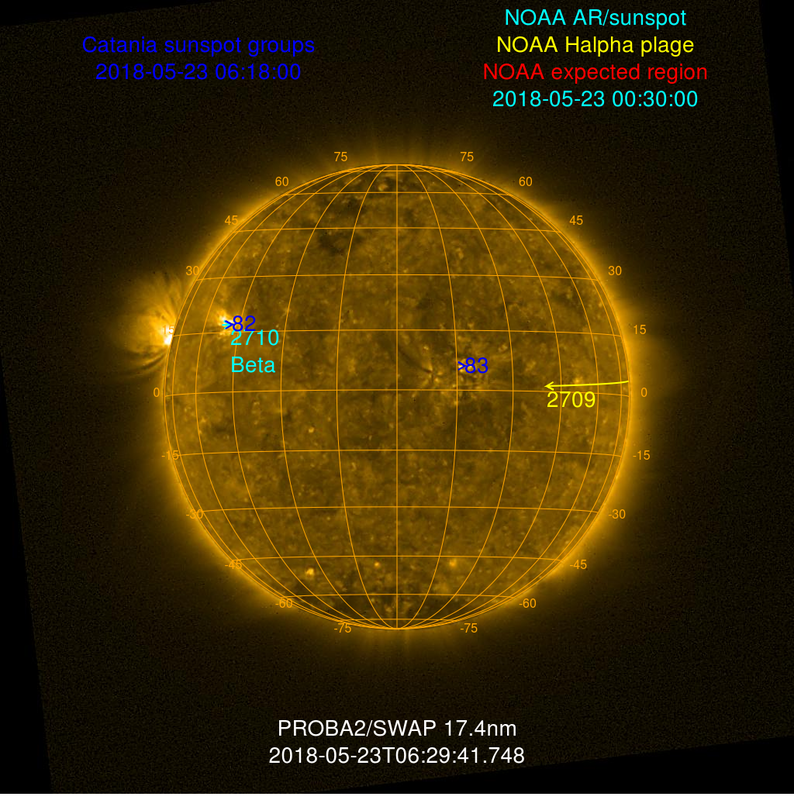 K-Coronagraph  Real-time Solar Activity For more data go to https://sdo.gsfc.nasa.gov/data/ 
Monthly Averaged Sunspots Numbers From 1750 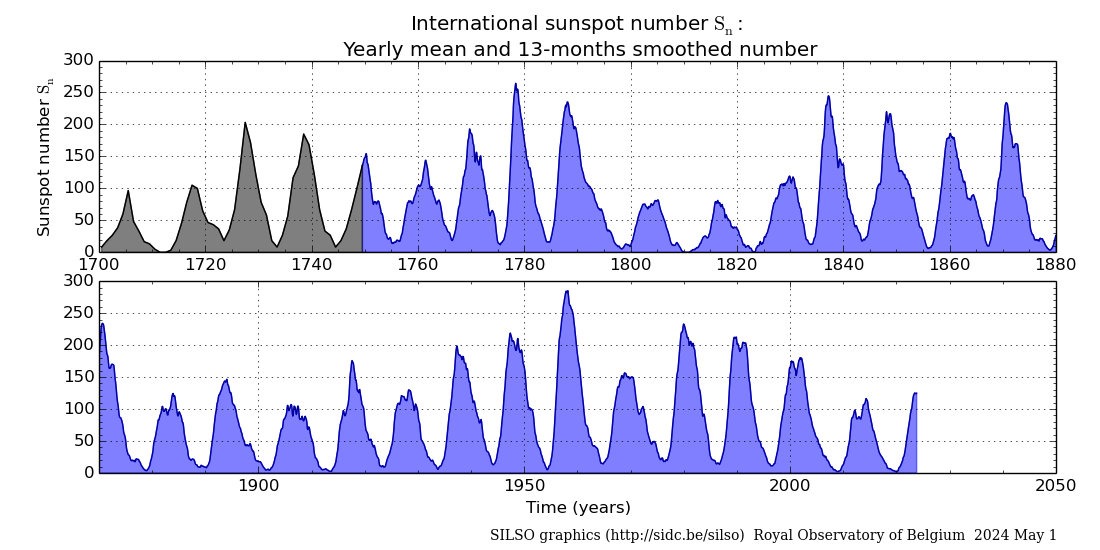
|
Sunspot Graphs 1996 to 2025 ) 2025 [ data ] ) 2024 [ data ] ) 2023 [ data ] ) 2022 [ data ] ) 2021 [ data ] ) 2020 [ data ] ) 2019 [ data ] ) 2018 [ data ] ) 2017 [ data ] ) 2016 [ data ] ) 2015 [ data ] ) 2014 [ data ] ) 2013 [ data ] ) 2012 [ data ] ) 2011 [ data ] ) 2010 [ data ] ) 2009 [ data ] ) 2008 [ data ] ) 2007 [ data ] ) 2006 [ data ] ) 2005 [ data ] ) 2004 [ data ] ) 2003 [ data ] ) 2002 [ data ] ) 2001 [ data ] ) 2000 [ data ] ) 1999 [ data ] ) 1998 [ data ] ) 1997 [ data ] ) 1996 [ data ] Click on any image above for full size image, window will close if you click outside popup |
News - Aug 2015 |
| On August 7th 2015 a IAU press release on sunspot activity, Unmentioned in the press release is that solar activity has altered climate three times in the last
400 years. Each time resulted in global cooling and it-s about to happen again. The three cooler
times are the Maunder, Dalton and a weak unnamed minimum between 1880 and 1915. The weakest of the three solar-induced cooling trends occurred during the unnamed minimum. It-s the only one documented in the IPCC-s HadCRUT4 global land-sea temperature database, which only goes back to 1850. The first two, the Maunder and Dalton, were before 1850. It-s evidence-based speculation at this time, but the current trend in solar activity shown above indicates another minimum of solar activity, tentatively name the "Eddy Minimum", is on its way. The IPCC has already said that lower sunspot activity will slow global warming over the next few decades, but not reverse it. |
News - May 2013 |
| The super-active sunspot responsible for unleashing the three most powerful solar flares of 2013 within a 24-hour stretch this week is slowly rotating toward Earth and will
likely be facing our planet by the weekend, experts say. Active Region 1748, as the sunspot is known, unleashed three monster solar flares between Sunday and Monday (May 12 to 13). Every one of the solar storms registered as an X-class flare - the most powerful type - with each successive event stronger than the last, culminating in an X3.2 megablast Monday night. These solar explosions did not affect Earth, since AR1748 was not facing our planet at the time. But the sunspot is now circling into view, so future flares and any associated eruptions of super-hot solar plasma - called coronal mass ejections (CMEs) - could potentially target our planet, scientists say. |
News - Nov 2011 |
| One of the largest sunspots in years has appeared on the sun, darkening part of its glowing face. The massive sunspot, called AR1339, is about 50,000 miles long, and 25,000 miles wide. |
News - Jan 2011 |
| UK partial solar eclipse 4th Jan 2011 just after sunrise Serious eye damage or possibly lead to permanent blindness, can result from viewing the Sun directly with the naked eye or with any unfiltered optical device, such as binoculars or a telescope. You must use CE approved safety solar eclipse glasses. Eclipse safety code It is dangerous to look at the sun at any time, viewing the sun during a partial eclipse requires special protection or indirect viewing methods Only properly designed and certified solar filters should be used for direct viewing of the sun-s disk. These must be identified as suitable for direct viewing of the sun, bear the CE mark, and a statement that it conforms to EC Directive 89/686/EEC Source: Department of Health |
News - October 2010 |
| An analysis of satellite data challenges the intuitive idea that decreasing solar activity cools Earth, and vice versa. In fact, solar forcing of Earth-s surface climate seems to work the opposite way around - at least during the current Sun cycle. Atmospheric physicist at Imperial College London found that the amount of visible light reaching Earth increased as the Sun-s activity declined - warming the Earth-s surface. Their unexpected findings are published in Nature Some meteorologists believe, for example, that during phases of low solar activity, -blocking events- - unusual patterns in westerly air currents that can cause cold snaps and freak weather in Europe - occur more frequently. |
News - September 2010 |
| Scientists studying sunspots for the past 2 decades have concluded that the magnetic field that triggers their formation has been steadily declining. If the current trend continues, by 2016 the sun-s face may become spotless and remain that way for decades a phenomenon that in the 17th century coincided with a prolonged period of cooling on Earth. The last solar minimum should have ended last year, but something peculiar has been happening. Although solar minimums normally last about 16 months, the current one has stretched over 26 months-the longest in a century. This has happened before, sunspots disappeared almost entirely between 1645 and 1715 during a period called the Maunder Minimum, which coincided with decades of lower-than-normal temperatures in Europe nicknamed the Little Ice Age. |
News - September 2009 |
| The Sun goes through a regular 11-year cycle of active periods and quiet periods. The active periods are marked by an increase in sunspots dark regions of intense magnetic activity on the surface of the Sun. Sunspot activity rises and falls roughly every 11 years - the last maximum was in 2001, and activity slowly fell off to zero by 2006 and since then almost nothing. Scientists had expected sunspot activity to start increasing by now, but it hasn-t. No one knows why, or when the cycle will pick up again. Now, "active" and "quiet" are relative terms. The amount of energy released by the Sun in its "active" phase is only 1/10th of 1% more than that released during its "quiet" phase. In other words, a quiet Sun is still putting out 99.9% as much energy as an active Sun. A new study by the National Center for Atmospheric Research and published in the journal Science argues that the increased solar output warms ozone in the upper atmosphere. This extra energy creates more ozone, which traps more heat, which creates more ozone, which you get the idea. It-s a feedback loop. The end result is stronger winds. These winds reduce clouds over the Pacific Ocean, allowing it to warm up as well. So you-ve got heat coming down from the sky, and more heat coming up from the ocean, the end result of which is that the Earth warms more than twice as much as you would expect from the increased Sun activity alone. The low number of sunspots over the last couple of years may at least partially explain our unusually cool summers of late. |
Note
- For those using my script, change
- 12th Dec 2017 - Old links appear to be working again, so no need to change anything
- 10th Dec 2017 - data url changed from $ftp_server = "ftp://ftp.swpc.noaa.gov/pub/latest/DSD.txt";
To
$ftp_server = "http://services.swpc.noaa.gov/text/daily-solar-indices.txt"; - 16th Jan 2015 - See Update to script forum page
- 16th Jan 2015 - See Download page for scripts
Also the last qtr script no longer has a data file to download from swpc, so remove
Credits:
Space Weather Images and Information (excluded from copyright) courtesy of:NOAA / NWS Space Weather Prediction Center
Mauna Loa Solar Observatory (HAO/NCAR)
SOHO (ESA & NASA)
The Very Latest SOHO Images
Sunspots data archive from SOHO
ESA - SOHO Site
SIDC, sunspot data from the Royal Observatory of Belgium
WDC-SILSO, Royal Observatory of Belgium, Brussels
World Data Center for Sunspot Numbers
SOHO stands for SOlar Heliospheric Observatory.
SIDC stands for Solar Influences Data analysis Center.
Thanks to Lee from MadALwx.
